
The Best Tips to Improve Your Spreadsheet Skills for Work
Spreadsheets are more than just a tool for tracking numbers and organizing data. In today’s world, they’re an essential part of almost every workplace. Whether you’re managing budgets, analyzing sales figures, or creating reports, being able to efficiently use spreadsheets like Excel or Google Sheets can significantly boost your productivity and save you time. But if you’re just getting started, or even if you’ve been using spreadsheets for years, there’s always room for improvement. So how do you go about sharpening those skills? Let’s dive into the best tips to enhance your spreadsheet capabilities and make your work life a whole lot easier.
We spend a significant portion of our days working with data. From handling personal finances to collaborating with teams on project reports, spreadsheets are everywhere. Yet, most people don’t take full advantage of the features these programs offer. It’s easy to get stuck in the basics, simply using them as a fancy way to organize numbers. But if you really want to get ahead, you’ll need to expand your knowledge and go beyond what’s immediately obvious. By learning new functions, mastering formulas, and exploring data visualization, you’ll not only improve your efficiency but also gain confidence in your ability to manage complex tasks.
But let’s face it - spreadsheets can be intimidating. They often look overwhelming, especially when you open a large file filled with rows and columns of raw data. However, breaking things down step by step and focusing on key areas of improvement can transform how you work with spreadsheets. Here’s how to level up your spreadsheet skills, whether you’re just getting started or looking to refine your expertise.
1. Learn the Basics Inside and Out
Before diving into advanced features, it’s crucial to get the basics right. Mastering the fundamental tools will make everything else easier as you move on to more complex tasks.
- Functions and Formulas: The backbone of any spreadsheet is its ability to calculate data using functions and formulas. Even if you’ve been using spreadsheets for a while, take the time to review the most common ones:
- SUM – Adds a range of numbers together.
- AVERAGE – Finds the average of a set of numbers.
- MIN / MAX – Identifies the smallest or largest value in a dataset.
- COUNT – Counts the number of data entries within a range.
- IF – This function allows you to create conditional logic (e.g., if a certain value is met, return this value, otherwise return something else).
- VLOOKUP (or XLOOKUP in newer Excel versions) – Searches for a specific value in one column and returns a corresponding value from another column.
- Cell Referencing: Understanding how cells relate to one another is crucial for constructing your formulas. There are three types of cell references to get acquainted with:
- Relative References (e.g., A1): These change when you copy and paste the formula into another cell.
- Absolute References (e.g., $A$1): These don’t change when you copy the formula to a different location.
- Mixed References (e.g., $A1 or A$1): These references allow part of the formula to stay constant while the other part shifts.
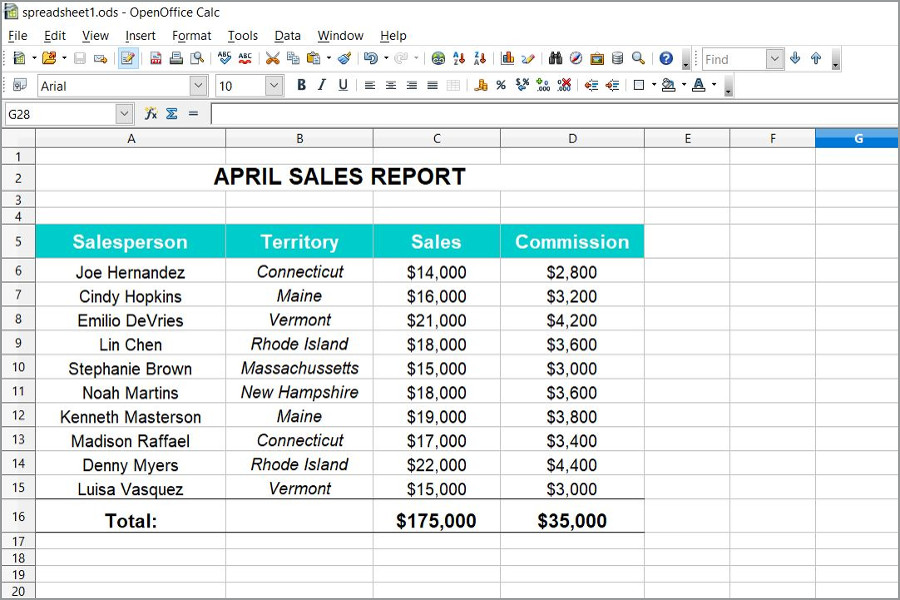
- Formatting: Making your data readable and visually appealing is just as important as organizing it. Learn how to format cells for different types of data:
- Currency formatting for financial data.
- Percentage formatting for growth rates or comparisons.
- Date formatting for tracking timelines or schedules.
- Text formatting for labels, descriptions, or names.
Conditional formatting is also an incredibly helpful tool. It lets you apply specific formatting rules based on the data within the cell. For example, you can highlight sales figures that exceed a target or use color coding to show performance over time.
2. Get Comfortable with Data Visualization
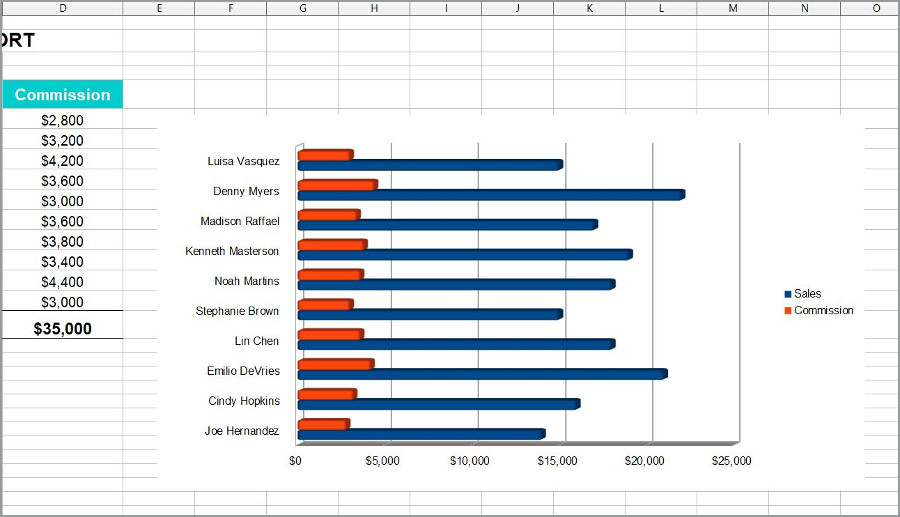
Data visualization is a game changer when it comes to understanding complex datasets. It turns raw numbers into insights, making it easier to spot trends, identify outliers, and communicate findings.
- Charts and Graphs: Learn how to create the most effective types of charts for your data. Each type serves a specific purpose:
- Bar Charts: Great for comparing values across different categories.
- Line Charts: Perfect for showing trends over time, like monthly sales or yearly growth.
- Pie Charts: Useful for visualizing proportions or percentages.
- Scatter Plots: Ideal for showing correlations between two sets of data.
- Pivot Tables: Pivot tables are one of the most powerful tools for summarizing large amounts of data. They allow you to:
- Group data by categories (e.g., by region or by product).
- Perform calculations like sums, averages, or counts within different groups.
- Filter and drill down into specific subsets of your data.
Once you get the hang of pivot tables, you’ll wonder how you ever managed without them. They save time and give you the ability to quickly generate summaries and insights.
- Sparklines: These are small, simple charts embedded within cells that give you a quick visual representation of data trends. For example, sparklines could show the performance of a product over the past few months, giving you an at-a-glance overview of its sales trend.
3. Master Advanced Functions
Once you’ve mastered the basics, it’s time to explore more advanced functions that can help you handle more complex tasks and make your work even more efficient.
- IF Statements: The IF function is great for performing conditional checks, but you can take it a step further with nested IF statements. This allows you to handle multiple conditions within a single formula. You could use it to categorize sales performance as “Excellent,” “Good,” or “Needs Improvement” based on specific thresholds.
Alternatively, the IFS function (available in newer versions of Excel) allows you to check multiple conditions without having to nest them.
- INDEX & MATCH: These two functions are far more powerful and flexible than VLOOKUP. While VLOOKUP can only search for data from left to right, INDEX & MATCH can look up values in any direction, making them perfect for more complex spreadsheets. INDEX returns the value from a table based on a given row and column, while MATCH helps find the position of a value in a given range.
- Text Functions: In many cases, you’ll need to clean and manipulate text data. Here are some useful TEXT functions:
- LEFT / RIGHT: Extract a specific number of characters from the beginning or end of a text string.
- MID: Extract characters from the middle of a text string.
- CONCATENATE (or TEXTJOIN in newer versions): Combine data from multiple cells into one string.
- TRIM: Remove any extra spaces from a text string.
Mastering these functions will help you tidy up data and make it easier to work with.
- Array Formulas: Array formulas are a more advanced tool for performing complex calculations on multiple data points at once. For instance, you can use an array formula to multiply corresponding values from two columns and then sum the result, all in a single formula.
4. Learn to Use Keyboard Shortcuts
If you’re serious about improving your spreadsheet efficiency, mastering keyboard shortcuts is a must. These shortcuts can help you navigate and manipulate your spreadsheets faster, saving you a lot of time.
- Ctrl + Shift + L: Toggle filters in your spreadsheet, making it easy to sort and view specific data.
- Ctrl + Arrow Key: Jump to the edge of your data range, whether it’s the top, bottom, left, or right.
- Alt + E, S, V: Open the paste special menu to select from various paste options, like pasting only values, formulas, or formatting.
- Ctrl + C and Ctrl + V: Copy and paste data quickly.
- Ctrl + Z: Undo any recent actions.
Using shortcuts allows you to move more fluidly through your tasks, without getting bogged down by constantly switching between the mouse and keyboard.
5. Data Cleaning & Manipulation
Data rarely comes in a perfect format. Whether you’re importing data from a different source or manually entering it, you’ll often need to clean up and manipulate the data to make it usable.
- Remove Duplicates: If you have repetitive data in your spreadsheet, use the Remove Duplicates feature to quickly eliminate it. This ensures that your analysis and reports are accurate.
- Text-to-Columns: This tool is great for splitting data into multiple columns based on a specific delimiter, like commas or spaces. For instance, if you have a column of full names, you could split it into first and last names.
- Filters and Sorting: Filters let you view only the data that meets certain criteria, while sorting lets you organize your data in ascending or descending order. Both are essential tools for managing large datasets.
6. Automation & Macros
Automation is a key to improving your productivity, especially if you find yourself doing the same tasks repeatedly. Macros allow you to record and replay a series of actions, saving you time.
- VBA Macros: If you're using Excel, learning VBA (Visual Basic for Applications) will give you the power to create custom macros that automate everything from formatting to data analysis.
- Google Apps Script: Google Sheets users can take advantage of Google Apps Script, a JavaScript-based tool that allows you to write custom functions and automate tasks like sending reports or updating data.
7. Explore Templates & Real-Life Projects
Sometimes the best way to learn is by doing. Working with pre-built templates or taking on personal projects can help you apply what you’ve learned in a practical way.
- Templates: Excel and Google Sheets both offer a variety of templates for tasks like budgeting, project tracking, and invoicing. Explore these templates to see how others organize and structure their data.
- Personal Projects: Whether it's tracking your personal expenses or creating a fitness log, using spreadsheets for real-life projects gives you the chance to practice and improve your skills.
8. Practice with Online Resources
You don’t have to figure everything out on your own. There are plenty of online resources to help you improve your spreadsheet skills.
- Courses: Websites like Coursera, LinkedIn Learning, and Udemy offer comprehensive courses that cover everything from basic functions to advanced spreadsheet techniques.
- YouTube Tutorials: Free video tutorials can be a great way to learn new tricks and tips. You can follow along at your own pace and revisit lessons when needed.
- Forums: If you’re stuck on something, online forums like Stack Overflow and Reddit’s r/Excel are excellent places to ask questions and get advice from experienced users.
Conclusion
Becoming proficient with spreadsheets doesn’t have to be a daunting task. By mastering the basics, diving into data visualization, and learning advanced functions, you can unlock the full potential of these powerful tools. Regular practice, real-world application, and utilizing online resources will help you continue to improve and increase your productivity. So take the time to learn, experiment, and embrace new techniques - soon you’ll be handling spreadsheets like a pro!